
Populations Served
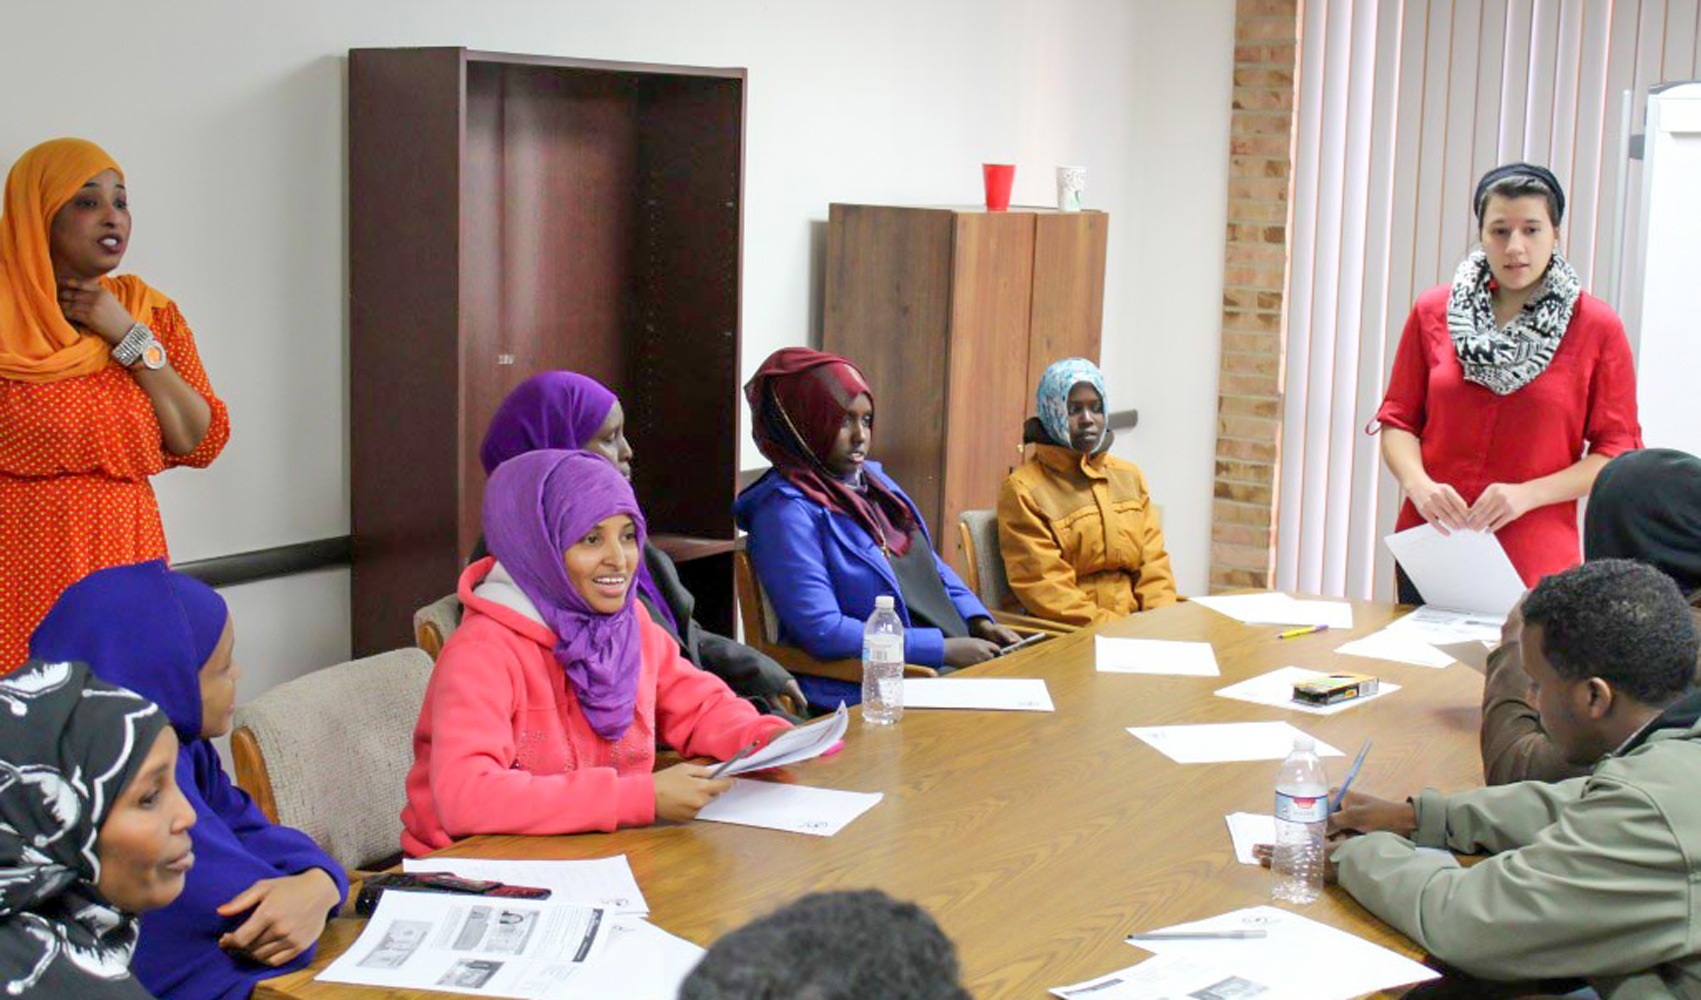
Throughout our history, we have accepted refugees and immigrants from all over the world. Our case managers work directly with these communities to help them preserve their customs and cultures while still integrating successfully into the United States. As we continue to accept diverse populations, we improve our cultural competency and international understanding.
Afghanistan
Algeria
Burundi
Cameroon
Chad
China
Democratic Republic of Congo
Eritrea
Ethiopia
Former Soviet Union
Iraq
Mali
Moldova
Mongolia
Myanmar
Nepali/Bhutanese
Pakistan
Rwanda
Somalia
Sri Lanka
Sudan
Syria
Tanzania
Uganda
Ukraine

“We often hear and tell the stories of struggle, persecution, torture, survival. We often hear and tell the stories about our journey to this country, but this is not the whole story. Our journey continues and stories of our successes should be told too.”
Nadia Kasvin, Co-founder and Director of US Together
Reports and Statistics
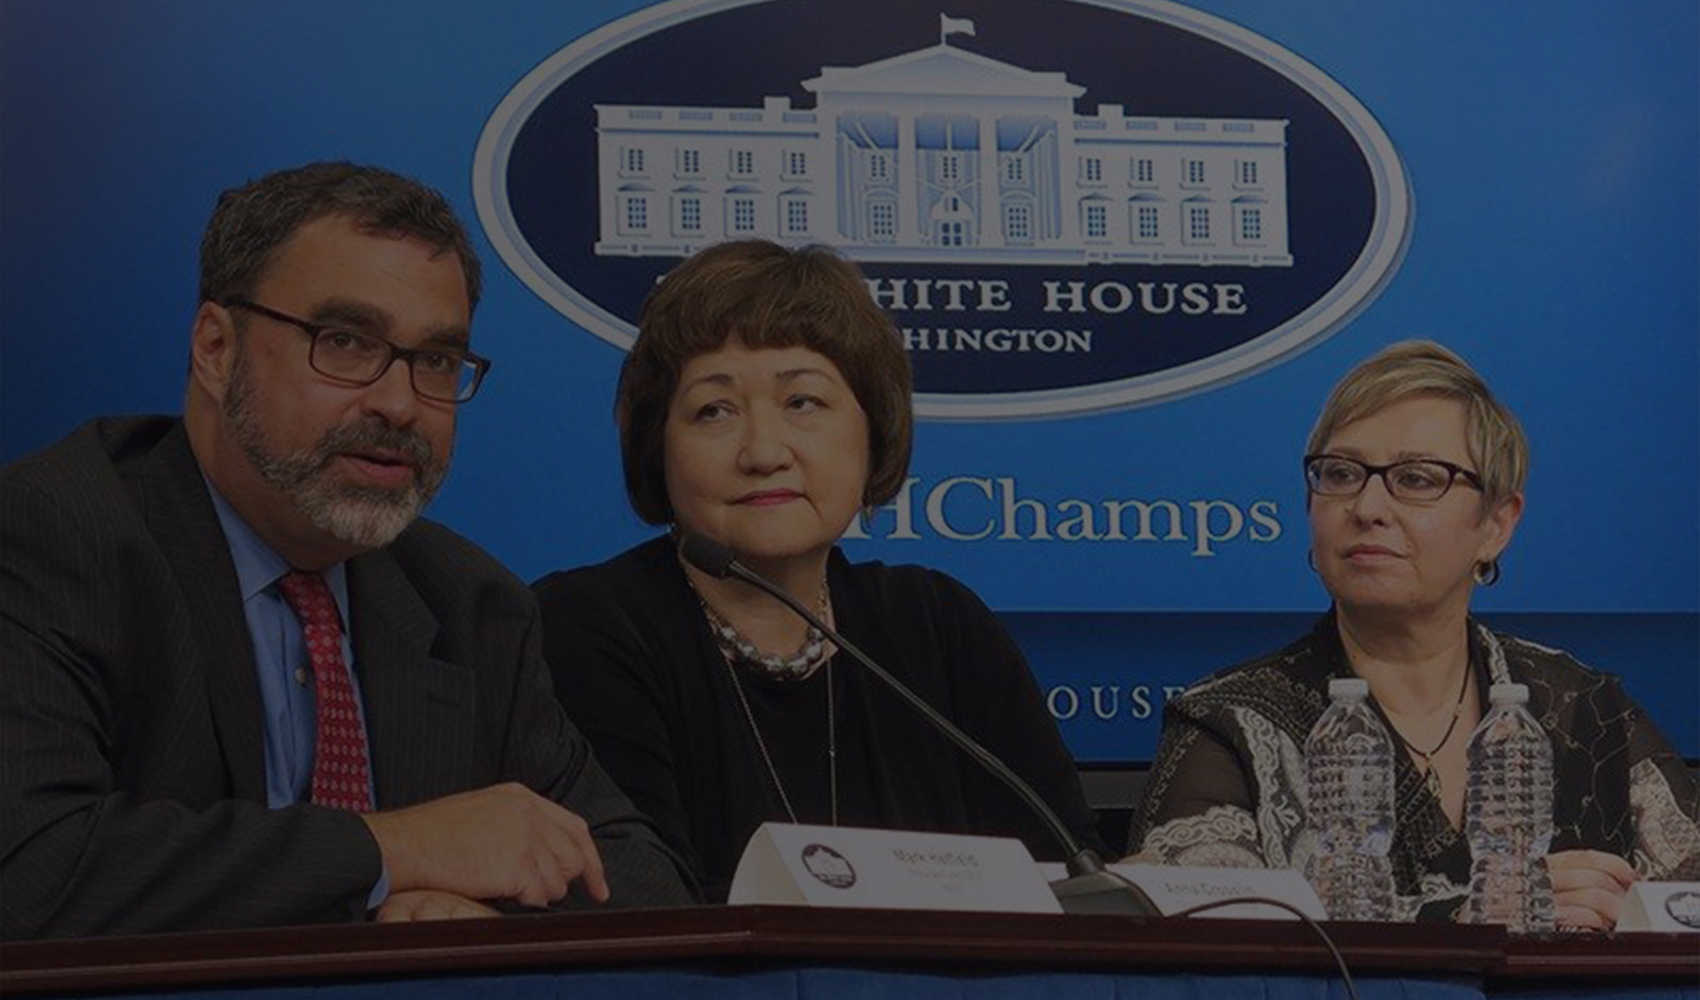
For a comprehensive understanding of Ohio’s immigrant and refugee populations, we have provided a link to more resources. In 2015, US Together teamed up with CRIS, World Relief, and the City of Columbus to perform an extensive analysis on the economic and social impact of refugees in the Central Ohio area.
See below for highlights:
Congressional Research Service: Refugee Admissions and Resettlement Policy
2015 Impact of Refugees on Central Ohio
Immigrants: Reviving the Great Lakes Region
41.8% of refugees age 18 and older are currently enrolled in college or have graduated from college, compared to 43.0% of all Franklin County residents age 18 and older; this suggests that refugees in the community are just as well-educated as the rest of the population.
13.6% of employed refugees who are age 16 and older are business owners; this is more than double the general Franklin County rate of entrepreneurship (6.5%), indicating that local refugees are more than twice as likely to own a business as the general population.
There are an estimated 873 refugee-owned businesses in the Columbus MSA, employing 3,960 workers.
Read More About US Together